OUR STRATEGIES
DIVIDENDS PAY DIVIDENDS®
Income Growth
Incepted in 2005, the Income Growth strategy was inspired by an unaddressed need among institutional clients to generate income today to fund spending objectives, but also grow income and principal over time to expand the mission of the client organization. Since inception, the Income Growth strategy has focused on the following prioritized objectives:
- Generate high current and growing income;
- Provide downside protection, and;
- Provide price appreciation potential.
These objectives are ordered according to the degree of control Bahl & Gaynor’s Investment Committee believes it can exert in the face of market uncertainty through our bottom-up, fundamental research process.
The strategy seeks to invest in securities with a minimum current dividend yield of 2.0% and therefore provide a portfolio yield competitive to its S&P 500 benchmark. Over a full market cycle, Income Growth seeks to deliver income growth ahead of inflation and a competitive risk-adjusted return experience to clients relative to other large-cap core peers and its benchmark. Client portfolios will generally be diversified among a selection of 40 to 50 common stocks with each security’s capital concentration and income contribution limited for risk management purposes. Low portfolio turnover combined with the favorable tax treatment of dividend income results in a cost and tax-efficient portfolio.
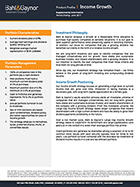
- Current dividend yield of 2.8%
- Average S&P earnings and dividend quality ranking of A-
- Weighted-average market capitalization of $163.5 billion
Top 10 Holdings |
Portfolio Percentage |
S & P Equity Quality Ranking |
Cisco Systems (CSCO) |
4.70% |
B+ |
Microsoft (MSFT) |
4.67% |
B+ |
NextEra Energy (NEE) |
4.09% |
A |
JPMorgan Chase (JPM) |
3.83% |
A- |
Texas Instruments (TXN) |
3.70% |
A |
McDonald's (MCD) |
3.42% |
A |
BB&T (BBT) |
3.24% |
B+ |
Home Depot (HD) |
3.23% |
A+ |
Honeywell (HON) |
3.18% |
A- |
PepsiCo (PEP) |
2.96% |
A- |
Large Cap Quality Growth
As Bahl & Gaynor’s longest-running strategy, Large Cap Quality Growth has been managed since the firm’s inception in 1990. The inspiration for this strategy was drawn from the portfolio management style Bill Bahl and Vere Gaynor applied with founding clients of Bahl & Gaynor in their roles prior to forming the firm. The Large Cap Quality Growth strategy seeks to achieve the following objectives:
- Generate current and growing income;
- Provide downside protection, and;
- Provide price appreciation potential.
Although the objectives of this strategy are similar to Income Growth, Large Cap Quality Growth seeks to provide a different set of advantages to clients. First, the current portfolio yield of the strategy will typically approximate the strategy’s primary benchmark, the S&P 500, whereas Income Growth generally provides a premium yield to this index. Second, and as a result of a relatively lower yield today, the strategy should seek to provide a faster rate of future dividend growth to clients than Income Growth. Third, because of a lower current yield, the strategy will be relatively more volatile than the Income Growth strategy, but still generally less volatile than the overall market.
Over a full market cycle, Large Cap Quality Growth seeks to deliver income growth that exceeds the rate of inflation and a competitive risk-adjusted return experience to clients compared to other large-cap growth peers and its benchmarks. Client portfolios will typically be diversified among a selection of 45 to 55 holdings. Low portfolio turnover combined with the favorable tax treatment of dividend income results in a cost and tax-efficient portfolio.
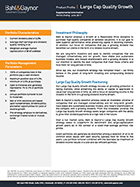
- Current dividend yield of 2.3%
- Average S&P earnings and dividend quality ranking of A-
- Weighted-average market capitalization of $176.3 billion
Top 10 Holdings |
Portfolio Percentage |
S & P Equity Quality Ranking |
Microsoft (MSFT) |
4.30% |
B+ |
Cisco Systems (CSCO) |
3.97% |
B+ |
NextEra Energy (NEE) |
3.92% |
A |
JPMorgan Chase (JPM) |
3.65% |
A- |
Texas Instruments (TXN) |
3.35% |
A |
Home Depot (HD) |
3.35% |
A+ |
Honeywell International (HON) |
3.15% |
A- |
Apple (AAPL) |
3.06% |
B+ |
Estee Lauder (EL) |
2.94% |
A |
Broadridge (BR) |
2.81% |
A- |
Mid Cap Quality Growth
After more than a decade of managing the Large Cap Quality Growth strategy, Bahl & Gaynor’s Investment Committee examined the possibility of extending this discipline down the market capitalization range to include a mid-cap approach. After determining such an approach was viable given sufficient size of the investable universe, the Mid Cap Quality Growth strategy was incepted in 2003. The strategy seeks to achieve the following objectives:
- Provide price appreciation potential,
- Provide downside protection, and;
- Income.
Mid-cap companies that pay a dividend, and especially those companies that regularly grow their dividend, are often more stable and established businesses with niche product or service offerings that have clear avenues identified for continued scale and growth. In fact, several mid-cap companies held at one time or another in the Mid Cap Quality Growth strategy have subsequently graduated to ownership in Bahl & Gaynor’s larger-cap strategies. The strategy provides an avenue for clients to access smaller market cap stratifications that are generally more volatile than larger-cap market segments, while managing risk and capturing the benefit of a rising income stream.
Over a full market cycle, the strategy seeks to provide risk-adjusted returns competitive to mid-cap growth peers and its primary Russell Mid Cap Growth benchmark as well as an income stream positioned for future growth. Client portfolios will generally be diversified among 40 to 60 common stocks with a market cap between $2 billion and $30 billion. Low portfolio turnover combined with the favorable tax treatment of dividend income results in a cost and tax-efficient portfolio.
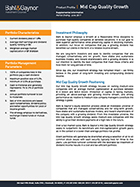
- Current dividend yield of 1.7%
- Average S&P earnings and dividend quality ranking of B+
- Weighted-average market capitalization of $10.3 billion
Top 10 Holdings |
Portfolio Percentage |
S & P Equity Quality Ranking |
Steris (STE) |
4.09% |
NR |
CDW Corp (CDW) |
4.07% |
NR |
Cintas (CTAS) |
3.69% |
A- |
Broadridge (BR) |
2.94% |
A- |
West Pharmaceutical (WST) |
2.92% |
A- |
Simpson Manufacturing (SSD) |
2.84% |
A- |
Encompass Health (EHC) |
2.84% |
B |
HEICO (HEI) |
2.83% |
A |
Synnex (SNX) |
2.63% |
B+ |
Agilent (A) |
2.62% |
B |
smig® – Small/Mid Cap Income Growth
Due to the success enjoyed by Bahl & Gaynor’s large cap Income Growth strategy and further motivated by our ability to identify viable investment opportunities down the market cap range, the smig® strategy was incepted in 2013 by applying the same prioritized objectives to a portfolio of companies with market caps ranging from $200 million to $15 billion. The smig® – Small/Mid Cap Income Growth strategy seeks to deliver on the following prioritized objectives:
- Generate high current and growing income;
- Provide downside protection; and,
- Provide price appreciation potential.
The smig® strategy allows Bahl & Gaynor clients to capitalize on a typically under-represented portion of the market cap range: small and mid-cap companies. It is our belief that companies in this market cap range with an established discipline of paying and growing a dividend have attractive future growth opportunities but are also carefully manage enterprise risk. This should yield a favorable risk-reward profile for clients over a full market cycle that is attractive relative to small and mid-cap core peers and the Russell 2500 core benchmark. Further, the strategy provides clients the uncommon opportunity to monetize their equity investment in this space through an attractive current yield that has historically exceeded that of the strategy’s benchmark.
Client portfolios will generally be diversified among 45 to 65 common stocks with each security’s capital concentration and income contribution limited for risk management purposes. Low portfolio turnover combined with the favorable tax treatment of dividend income results in a cost and tax-efficient portfolio.
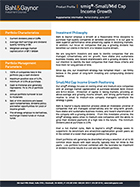
- Current dividend yield of 2.9%
- Average S&P earnings and dividend quality ranking of B+
- Weighted-average market capitalization of $7.1 billion
Top 10 Holdings |
Portfolio Percentage |
S & P Equity Quality Ranking |
Maxim Integrated Products (MXIM) |
3.61% |
B+ |
Arthur J. Gallagher (AJG) |
3.09% |
A |
Atmos Energy (ATO) |
2.91% |
A- |
Fastenal (FAST) |
2.91% |
A |
Hubbell (HUBB) |
2.67% |
A- |
Encompass Health (EHC) |
2.64% |
B |
Quest Diagnostics (DGX) |
2.54% |
B+ |
Watsco (WSO) |
2.43% |
A |
Broadridge (BR) |
2.34% |
A- |
RPM International (RPM) |
2.30% |
B+ |
Small Cap Quality Growth
The Small Cap Quality Growth strategy was formed in 2005, shortly after the Mid Cap Quality Growth strategy, confirmed by the same determination reached by Bahl & Gaynor’s Investment Committee: there exists a sufficient variety of small cap dividend-paying stocks to formulate an attractive strategy. The Small Cap Quality Growth strategy seeks to achieve the following objectives:
- Provide price appreciation potential,
- Provide downside protection, and;
- Income
The Small Cap Quality Growth strategy allows Bahl & Gaynor clients to capitalize on exposure to a typically volatile market cap range by managing risk through a high-quality, dividend-oriented approach. This focus should yield favorable risk-adjusted returns over a full market cycle relative to small-cap growth peers and the Russell 2000 Growth benchmark.
Client portfolios will generally be diversified among 65 to 85 common stocks with a market cap between 10% of the Russell 2000 Growth benchmark weighted average market cap (approximately $200 million) and 200% of the same benchmark’s weighted average market cap (approximately $5 billion). Low portfolio turnover combined with the favorable tax treatment of dividend income results in a cost and tax-efficient portfolio.
- Current dividend yield of 1.5%
- Average S&P earnings and dividend quality ranking of B+
- Weighted-average market capitalization of $2.8 billion
Top 10 Holdings |
Portfolio Percentage |
S & P Equity Quality Ranking |
Inter Parfums (IPAR) |
2.96% |
B+ |
Nextstar Media (NXST) |
2.59% |
B |
Brunswick (BC) |
2.47% |
B |
Evercore (EVR) |
2.47% |
B |
Chemed (CHE) |
2.42% |
A |
Synnex (SNX) |
2.31% |
B+ |
Healthcare Services Group (HCSG) |
2.27% |
A- |
First Financial Bancorp (FFBC) |
2.25% |
B+ |
Omnicell (OMCL) |
2.22% |
B |
Pegasystems (PEGA) |
2.20% |
B+ |